Flere ha sikkert fått med seg Don Keeles nye høyttalerkonsept CBT. Mange mener det er snakk om det største som har skjedd innenfor høyttalerteknologi på mange år og representerer en liten evolusjon. Polarresponsen er nemlig svært bra. Vertikalt måler de fantastisk, og horisontalt ser det også ut til å være svært bra. Dog har vært en del som har stilt spørsmål ved den horisontale spredningen til CBT36 og det er foreløpig presentert færre målinger på dette området. Tenkte derfor jeg skulle videreformidle noe fra Don Keele.
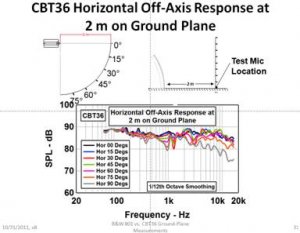
Som kan se fra sammenligningen mellom B&W 801, så faller den ganske mye over 5 khz ved 90°.
http://audioartistry.com/brochures/B&W 801 vs. CBT36 Ground-Plane Measurements v8.1.pdf
Men disse målingene er tatt på et ujevnt betonggulv, noe som man også kan se fra bildene i pdf filen. Don Keele skriver:
The slide shows responses measured with the test mic on the floor. The 90° curve rolls off above 5 kHz because of roughness of the concrete floor in our shop. Measured over a shiny tile floor its essentially flat!
We are soon going to be measuring an additional set of CBT36 measurements of the response vs. height (0 to 2.5 m, step 0.5 m) at several off-axis horizontal angles (0 to 90°, step 15°). This will included with the B&W vs CBT36 measurements. We will measure this set over a good floor however!
In lieu of these measurements, the attached CBT36 simulations show essentially the same thing but simulated at several distances from the base of the array at 0.5, 1, 2, 3, 10, and 250 m. The simulations of course do not include box diffraction effects. Note that the aspect ratio of all graphs is 25 dB/decade.
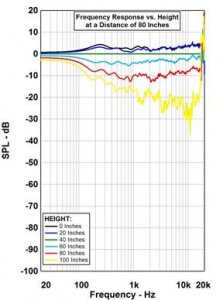
Heres the graph at 2 m from the base of the array and 75° off-axis horizontal:
The red curve is at a height of 2 m which is 0.5 m above the top of the array (array is 1.5 m tall) and is fully 10 dB below the 1 m listening height level! All curves are normalized to the response at 1 m high (green response curve) at that specific angle. Note that the level increases towards the floor (black, blue curves) but dramatically decreases as you go up (blue, red, and yellow curves).
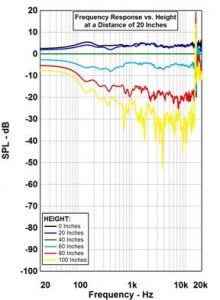
Heres the corresponding 75° curves, but much closer to the array at 0.5 m. Note that the 1.5 m level at the top of the array (blue) is 6 - 7 dB below the level at the listening height of 1 m. At a point igher at 0.5 m above the top of the array (red), the level is down some 15 to 20 dB but still fairly flat!
So whats the conclusion? Yes the CBT36 does illuminate the walls, but with essentially a spectrum that is quite flat and that decreases considerably with height at distances particularly close to the array.
The behavior of the CBT36 over the ground is completely unique and is dramatically different and extraordinarily better than any speaker that has come before!! Just repeat the same set of over-the-floor measurements on any other manufacturers speaker and you will find out!
Litt reklame på slutten, men det kan virke som om Don Keele har sine ord i behold. CBT vil spre mer til sidene enn f.eks waveguide al'a Geddes eller hornhøyttalere, men mindre enn B&Wene. I motsetning til høyttalere med smal spredning oppover i frekvens vil de derimot være mer konstante. Så man får mer siderefleksjoner, men med en mye uniform respons. Om man er avhengig av å dempe sideveggene avhenger nok av avstanden og hvorvidt man ønsker en super korrekt gjengivelse eller noe mer lateralt bidrag.
Her er en kommentar fra Keele angående dette:
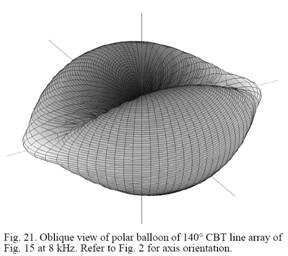
The horizontal coverage of the CBT36 is a function of the horizontal off-axis angle and actually gets narrower as you go off-axis. Heres a fig from my paper to illustrate that illustrates the sound field of a free-standing circular-arc CBT line array. Because the array is a ground-plane array the narrowing goes down to floor level, i.e. you get less and less illumination of the side walls as you go around the side. If you listen to the system on the side, it gets louder and louder as you squat down!
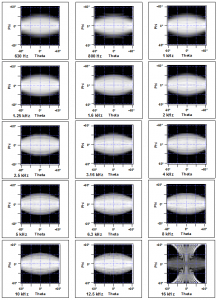
A complete set of ±60º horizontal x ±60º vertical footprint plots at all one-third octaves over the frequency range of 630 Hz to 16 kHz. In each footprint plot, the pressure in dB is normalized to the maximum in the stated angular range and is shown as a grey-scale density plot (high pressure in white and low in black).
Som kan se fra sammenligningen mellom B&W 801, så faller den ganske mye over 5 khz ved 90°.
http://audioartistry.com/brochures/B&W 801 vs. CBT36 Ground-Plane Measurements v8.1.pdf
Men disse målingene er tatt på et ujevnt betonggulv, noe som man også kan se fra bildene i pdf filen. Don Keele skriver:
The slide shows responses measured with the test mic on the floor. The 90° curve rolls off above 5 kHz because of roughness of the concrete floor in our shop. Measured over a shiny tile floor its essentially flat!
We are soon going to be measuring an additional set of CBT36 measurements of the response vs. height (0 to 2.5 m, step 0.5 m) at several off-axis horizontal angles (0 to 90°, step 15°). This will included with the B&W vs CBT36 measurements. We will measure this set over a good floor however!
In lieu of these measurements, the attached CBT36 simulations show essentially the same thing but simulated at several distances from the base of the array at 0.5, 1, 2, 3, 10, and 250 m. The simulations of course do not include box diffraction effects. Note that the aspect ratio of all graphs is 25 dB/decade.
Heres the graph at 2 m from the base of the array and 75° off-axis horizontal:
The red curve is at a height of 2 m which is 0.5 m above the top of the array (array is 1.5 m tall) and is fully 10 dB below the 1 m listening height level! All curves are normalized to the response at 1 m high (green response curve) at that specific angle. Note that the level increases towards the floor (black, blue curves) but dramatically decreases as you go up (blue, red, and yellow curves).
Heres the corresponding 75° curves, but much closer to the array at 0.5 m. Note that the 1.5 m level at the top of the array (blue) is 6 - 7 dB below the level at the listening height of 1 m. At a point igher at 0.5 m above the top of the array (red), the level is down some 15 to 20 dB but still fairly flat!
So whats the conclusion? Yes the CBT36 does illuminate the walls, but with essentially a spectrum that is quite flat and that decreases considerably with height at distances particularly close to the array.
The behavior of the CBT36 over the ground is completely unique and is dramatically different and extraordinarily better than any speaker that has come before!! Just repeat the same set of over-the-floor measurements on any other manufacturers speaker and you will find out!
Litt reklame på slutten, men det kan virke som om Don Keele har sine ord i behold. CBT vil spre mer til sidene enn f.eks waveguide al'a Geddes eller hornhøyttalere, men mindre enn B&Wene. I motsetning til høyttalere med smal spredning oppover i frekvens vil de derimot være mer konstante. Så man får mer siderefleksjoner, men med en mye uniform respons. Om man er avhengig av å dempe sideveggene avhenger nok av avstanden og hvorvidt man ønsker en super korrekt gjengivelse eller noe mer lateralt bidrag.
Her er en kommentar fra Keele angående dette:
The horizontal coverage of the CBT36 is a function of the horizontal off-axis angle and actually gets narrower as you go off-axis. Heres a fig from my paper to illustrate that illustrates the sound field of a free-standing circular-arc CBT line array. Because the array is a ground-plane array the narrowing goes down to floor level, i.e. you get less and less illumination of the side walls as you go around the side. If you listen to the system on the side, it gets louder and louder as you squat down!
A complete set of ±60º horizontal x ±60º vertical footprint plots at all one-third octaves over the frequency range of 630 Hz to 16 kHz. In each footprint plot, the pressure in dB is normalized to the maximum in the stated angular range and is shown as a grey-scale density plot (high pressure in white and low in black).
Vedlegg
-
 18.9 KB Visninger: 292
 -
 19.7 KB Visninger: 274
 -
 20.9 KB Visninger: 270
 -
 10 KB Visninger: 262
 -
 25.4 KB Visninger: 266